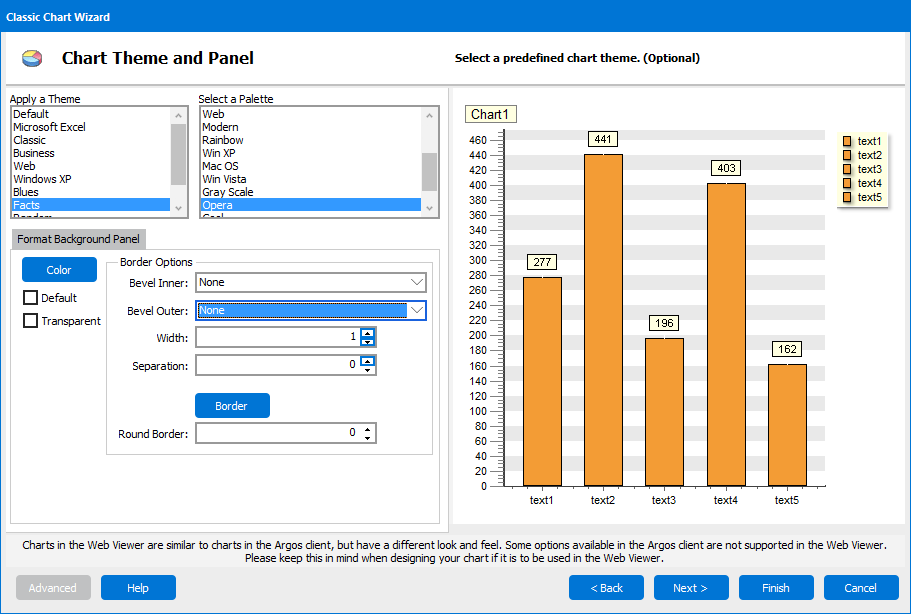
Chart Wizard - Theme and Panel
The second screen in the Chart Wizard gives you options for the overall look and feel of the chart.

Theme and Palette (classic charts only)
- The chart theme lets you specify various sets of options, including background color, lines, and fonts. You can choose from ten different options in the list.
- The palette controls the color used for the chart data.
Note: Theme and palette selections are not available for standard charts.
Format Background Panel
The Format Background Panel tab controls the look and feel of the panel behind the chart. This tab contains different options depending on whether you are creating a classic chart (shown above) or a standard chart (shown below).
![]()
Background Options
Options available for both charts are:
- Color - Sets the color for the background panel. Note: If you do not specify a background color, standard charts will have a white background in the Argos client and a transparent background in the Web Viewer.
Classic charts include two additional options:
- Default - Resets the background color to the default color.
- Transparent - Makes the background transparent.
Border Options
The border options for standard charts are:
- Visible - Checking this box draws a border around the chart panel.
- Color - Specifies the color of the border.
- Width - Specifies the width of the border, in pixels.
- Style - Choose from a solid, dashed, or dotted line.
The border options for classic charts are:
- Bevel Inner - Add a raised or lowered bevel effect to the inner part of the panel border.
- Bevel Outer - Add a raised or lowered bevel effect to the outer part of the panel border.
- Width - Specifies the width of the bevel, in pixels.
- Separation - Controls the separation between the border and the chart, i.e. the "white space" around the chart.
- Border - Opens a dialog with options for creating a non-beveled border. Available properties include line style, width, and color, as well as dot spacing if the "Small Dots" line style is selected.
- Round Border - Rounds the corners of the chart when set to a value greater than 0.
See also: